Overview
Data represented visually is often easier to read. In this article we present a bar chart control, which presents content of a table. In the same way as in one of our previous examples the control loads its data from an Excel XML Spreadsheet. It looks traditional but there are just a few minor improvements added.
Download soruce code(Silverlight control library, sample application) C#, VS2008 RTM
View Live Demo
In General
There are three steps to create the control:
- Load the data from a .XAML
- Initialize the needed components
- Set their properties so that they arrange according to the size of the control.
Each time the control is resized we only perform the last step. But if you want to load new data after you loaded some you will have to initialize the control as a new.
We perform the last two steps separately for the two distinguishing objects:
For the chart andthe legend we have a structure that contains all their components.
The control is built using a few classes that extend framework classes:
Bar, BarGroup, MovableCanvas, MovableFramedCanvas. Let’s take a look at them.
Bar – extendedCanvas with additionalTextBlock value centered on top of it.
public class Bar: Canvas
{
private TextBlock value;
public Bar():base()
{
value = new TextBlock();
this.Children.Add( value );
}
private void Refresh()
{
value.SetValue( TopProperty, - value.ActualHeight );
value.SetValue( LeftProperty, this.Width / 2 - value.ActualWidth / 2 );
}
public double ValueFontSize
{
get { return value.FontSize; }
set { this.value.FontSize = value; Refresh(); }
}
public String Value
{
get { return this.value.Text; }
set { this.value.Text = value; Refresh(); }
}
public new virtual double Width
{
get { return base.Width; }
set{ base.Width = value; Refresh(); }
}
public new virtual double Height
{
get { return base.Height; }
set { base.Height = value; Refresh(); }
}
}
BarGroup – a list of Bar objects that are contained in a Canvas, with an additional TextBlock centered under the canvas. This class is not a great example of OOP but is good enough to save some writing so we use it anyway. Think of it as a list of Bar objects, but arranged in a Canvas. HereRefresh()distributes the bars in the main canvas leaving some space(margin) in the left and right end, and no space between them:
public class BarGroup: Canvas
{
private System.Collections.Generic.List<Bar> bar = new System.Collections.Generic.List<Bar>();
private double margin;
private double fontSizeCoefficient = 0.33;
private TextBlock label = new TextBlock();
public BarGroup(){…}
public void RemoveBar( int index )
public void AddBar( double height, String text )
private void InitializeColors()
public String Label
public double Margin
public double Count
public new double Width
public new double Height
public Bar this[ int index ] // Indexer declaration
{
get
{
// Check the index limits.
if ( index < 0 || index >= bar.Count )
return null;
else
return bar[ index ];
}
}
private void Refresh()
{
double w = ( this.Width - 2 * margin ) / bar.Count;
label.FontSize = Math.Pow( w * w, fontSizeCoefficient );
for ( int count = bar.Count, i = 0 ; i < count ; i++ )
{
bar[ i ].Width = w;
bar[ i ].ValueFontSize = Math.Pow( w * w, fontSizeCoefficient );
bar[ i ].SetValue( Canvas.TopProperty, this.Height - bar[ i ].Height );
bar[ i ].SetValue( Canvas.LeftProperty, margin + w * i );
bar[ i ].SetValue( Canvas.TagProperty, margin + w * i );
}
}
private void AlignLabel()
{
label.SetValue( Canvas.TopProperty, this.Height );
label.SetValue( Canvas.LeftProperty, ( this.Width - label.ActualWidth ) / 2 );
}
}
MovableCanvas utilizes the mouse events to easily create, as because its name explains, a movable canvas. As you can see in the second part of the figure we add the change of mouse position to the canvas coordinates.
public class MovableCanvas: Canvas
{
private Point draggingStartPoint = new Point();
private bool isDragging = false;
public MovableCanvas()
{
this.MouseLeftButtonDown += new MouseEventHandler( MoveableFrameCanvas_MouseLeftButtonDown );
this.MouseMove +=
new MouseEventHandler( MoveableFrameCanvas_MouseMove );
this.MouseLeftButtonUp += new MouseEventHandler( MoveableFrameCanvas_MouseLeftButtonUp );
}
. . .
void MoveableFrameCanvas_MouseMove( object sender, MouseEventArgs e )
{
if ( isDragging )
{
Canvas o = sender as Canvas;
if ( o != null )
{
o.SetValue( Canvas.LeftProperty,
( double )o.GetValue( Canvas.LeftProperty ) + e.GetPosition( ( System.Windows.UIElement )this.Parent ).X - draggingStartPoint.X );
o.SetValue( Canvas.TopProperty,
( double )o.GetValue( Canvas.TopProperty ) + e.GetPosition( ( System.Windows.UIElement )this.Parent ).Y - draggingStartPoint.Y );
draggingStartPoint =
e.GetPosition( ( System.Windows.UIElement )this.Parent );
}
else
throw new NullReferenceException();
}
}
MovableFramedCanvas – simply adds four lines in the ends of its canvas.
We use MovableFramedCanvas as foundation for the legend and chart.
public class MovableFramedCanvas: MovableCanvas
{
Line[] frame = new Line[ 4 ];
Color frameColor;
double frameThickness;
public MovableFramedCanvas()
{
for ( int i = 0 ; i < 4 ; i++ )
{
frame[ i ] = new Line();
this.Children.Add( frame[ i ] );
}
frame[ 0 ].X1 = -5;
frame[ 1 ].X1 = -5;
frame[ 2 ].Y1 = -5;
frame[ 3 ].Y1 = -5;
}
private void AdjustFrameHeight()
{
frame[ 1 ].Y1 = this.Height;
frame[ 1 ].Y2 = this.Height;
frame[ 2 ].Y2 = this.Height + 5;
frame[ 3 ].Y2 = this.Height + 5;
}
private void AdjustFrameWidth()
{
frame[ 0 ].X2 = this.Width + 5;
frame[ 1 ].X2 = this.Width + 5;
frame[ 3 ].X1 = this.Width;
frame[ 3 ].X2 = this.Width;
}
}
Here is a visual explaination for some of the variаbles in the project.
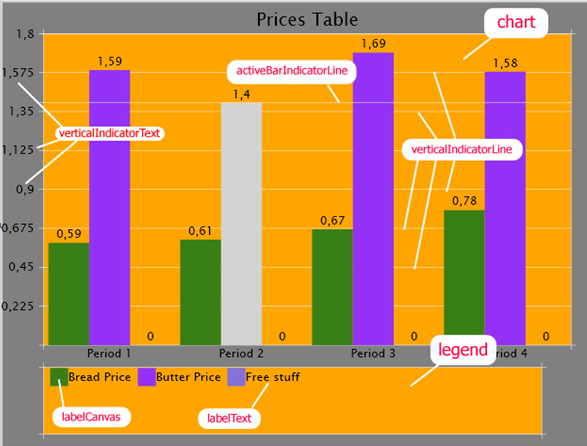
Legend
Our legend is actually a MovableFramedCanvas with the colors and their meanings added to it as child elements. For clarity let’s name the pair color and text (corresponding to a bar) to be a label. Then they are named labelCanvas and labelText respectively. Those three elements are grouped into the structure named LEGEND.
To create the legend we add the canvases and text blocks to the main canvas of the legend. You can see how these are distributed in RefreshLegendCanvas().
Chart
The chart contains all the bars that we loaded and a few lines to guide us through the values. We create the necessary bars using the class BarGroup and add them to the canvas of the chart. BarGroup extends Canvas so as to use it as a visual element.
private void InitializeBars()
{
chart.groups = new LinkedList<BarGroup>();
for ( int i = 0 ; i < numberGroups ; i++ )
{
BarGroup currentGroup = new BarGroup();
currentGroup.Margin = chartGroupsSpace;
currentGroup.Label = groupTitle[ i ];
chart.groups.AddLast( currentGroup );
for ( int j = 0 ; j < numberBars ; j++ )
{
currentGroup.AddBar( dataTable[ numberBars * i + j ] / scale * chart.canvas.Height, dataTable[ numberBars * i + j ].ToString() );
currentGroup[ j ].Background =
new SolidColorBrush( barsColors[ j ] );
currentGroup[ j ].MouseEnter += new MouseEventHandler( bar_MouseEnter );
currentGroup[ j ].MouseLeave +=
new EventHandler( bar_MouseLeave );
}
}
}
dataTable[] contains the actual data that we are displaying. You can see how it is extracted in LoadData(…).
As we mentioned above we take three steps to create the control.
In the first we load the data from XML Spreadsheet 2003 using the XMLReader class. Here is an example data.
See ChartDataLoader for more details.
After we have loaded the data we pass it to the chart control. We use a dictionary of dictionaries which presents the data in the following way:
dict{ “BreadPrice”:dictBreadPrice ; “MilkPrice”:dictMilkPrice ;… }
Where dictBreadPrice and the other inner dictionaries look like:
dictBreadPrice{ “January”:1.2 ; “February”:1.8 ; …}
The control extracts this data into the internal variables (see LoadData())and is ready for the next step.
In the second step we create all the needed components and set some of their parameters that won’t change if we resize the control. This is performed in Construct() and AllocationAndInitialization().
private void AllocationAndInitialization()
{
. . .
mainCanvas = new Canvas();
mainCanvas = chartRoot.FindName( "mainBox" ) as Canvas;
mainCanvas.Background = backgroundBrush;
chart.canvas = new MovableFramedCanvas();
chart.canvas = chartRoot.FindName( "chartBox" ) as MovableFramedCanvas;
chart.canvas.Background = new SolidColorBrush( Colors.Orange
. . .
};
The third step is repeated every time we resize the BarChart control. We recalculate all the sizes and alignments. Since we have a lot of components this is a big part of our code (more than 1/8).
private void Refresh()
{
if ( dataTable != null )
{
RefreshMainCanvas();
fontSize = FontSize();
RefreshChart();
RefreshLegend();
}
}
private void RefreshMainCanvas()
{
mainCanvas.SetValue( Canvas.TopProperty, parentCanvas.Height * 0.005 );
mainCanvas.SetValue( Canvas.LeftProperty, parentCanvas.Width * 0.005 );
mainCanvas.Height = parentCanvas.Height * 0.99;
mainCanvas.Width = parentCanvas.Width * 0.99;
leftProperty = mainCanvas.Width * 0.075;
topProperty = mainCanvas.Height * 0.075;
}
. . .
Conclusion
We won’t fall into details about the code though there are more explanations for most variables and functions in the code (specification-like). This is not the best example for implementation but our point is just to present what can be done using Silverlight 1.1 Alpha and this beautiful control is less than 900 lines of code.