This article is written for Silverlight 1.1.
Overview
As a new technology Silverlight 1.1 in its alpha version doesn’t allow to be used in real world applications, except for media players. We have a lot of examples demonstrating what is possible to be done in 1.1, but nothing really useful.
We, at SilverlightShow.net, think that it will be nice to have something useful that will help solving common tasks. One of these tasks is to show a simple chart on a web page. This is the first of many articles explaining how this could be done in Silverlight 1.1. Also you will find source code included.
Update: Read how to extend this chart to consume data from an Astoria service
The goal
The goal of this article is to give an example of how to handle the case, in which you put a chart on your web page and allow non-technical staff to deal with the correct chart data easily.
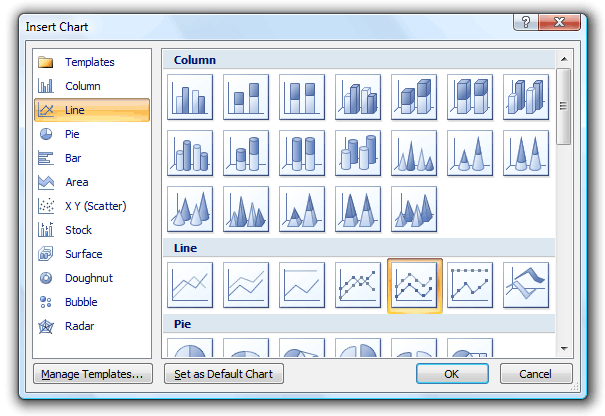
We will start with simple line chart that loads its data from XML file either a serialized list of points or an Excel chart exported as an XML file. In the next articles we will show how the data could be taken from a web service so the chart can be updated automatically. To maintain the chart, the dedicated staff should only replace the existing xml file with a new one.
The Solution
Download source (Silverlight control library and sample application) C#, VS2008 Beta2
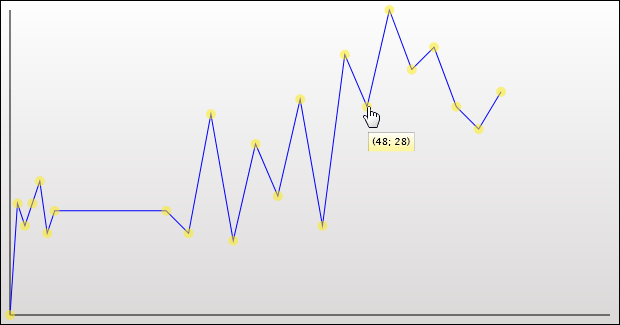
This part will focus on drawing the line, adding the data points (the yellow circles in the image above) and the tooltips. In the next parts we will add new features like metrics, grid layout, resizing, multiple lines, different visualizations, zooming etc.
The line chart is built as a Silverlight control library that you can use just by referencing the DLL. It can be completely configured through its properties and/or editing the XAML with Expression Blend 2.
The Basics
We assume that you know how to do common Silverlight tasks like Creating a Silverlight Custom Controls, have basic understandings of transformations and you are familiar with the framework elements.
The root Canvas of the chart contains two canvases: chartCanvas – where the line chart is displayed and tooltipCanvas for the tooltip is shown when the mouse is over a chart point. The chartCanvas contains also X-axis and Y-axis and a separate canvas where the chart will be drown - chartLineCanvas.
Let’s start with the XAML elements initialization needed for the chart. We start with declaring the chartCanvas with simple linear gradient background:
<Canvas x:Name="chartCanvas" Width="800" Height="600">
<Canvas.Background>
<LinearGradientBrush EndPoint="1,0.5" StartPoint="0,0.5">
<LinearGradientBrush.Transform>
<TransformGroup>
<ScaleTransform ScaleX="1" ScaleY="1" />
<SkewTransform AngleX="0" AngleY="0" />
<RotateTransform Angle="90" />
<TranslateTransform X="0" Y="0" />
</TransformGroup>
</LinearGradientBrush.Transform>
<GradientStop Color="#FFFFFFFF" Offset="0" />
<GradientStop Color="#FFBBB6B6" Offset="1" />
</LinearGradientBrush>
</Canvas.Background>
Then, the X- and Y-axis and the black border:
<Linex:Name="axisX" Stroke="Black" StrokeThickness="1"></Line>
<Linex:Name="axisY" Stroke="Black" StrokeThickness="1"></Line>
<Rectanglex:Name="chartArea" Stroke="Black"></Rectangle>
Now, the canvas where the chart line will be displayed – chartLineCanvas:
<Canvas x:Name="chartLineCanvas">
<Canvas.RenderTransform>
<TransformGroup>
<MatrixTransform Matrix="1,0,0,-1,0,0" />
</TransformGroup>
</Canvas.RenderTransform>
<Polyline x:Name="chartLine" Stroke="Blue" StrokeThickness="1">
</Polyline>
</Canvas>
Wait. Why we need this MatrixTransform? – In order to place the chart points, we need a true coordinate system where the Y coordinates grow from the down left corner to the top and the X coordinates grow from the down left corner to the right. Ok let’s go on.
The Polyline – this is a shape object used to connect straight lines. It is our main player – it draws the actual line chart. Read more about Polyline and Shapes if you need.
And finally the tooltip canvas - tooltipCanvas:
<Canvas x:Name="tooltipCanvas" Visibility="Collapsed">
<Rectangle x:Name="tooltipRectangle" Stroke="#FF000000" StrokeThickness="0.2">
<Rectangle.Fill>
<LinearGradientBrush EndPoint="1,0.5" StartPoint="0,0.5">
<LinearGradientBrush.Transform>
<TransformGroup>
<ScaleTransform ScaleX="1" ScaleY="1" />
<RotateTransform Angle="90" />
</TransformGroup>
</LinearGradientBrush.Transform>
<GradientStop Color="#FFFFFFFF" Offset="0" />
<GradientStop Color="#FFFFEA06" Offset="1" />
</LinearGradientBrush>
</Rectangle.Fill>
</Rectangle>
<TextBlock x:Name="tooltipText" Canvas.Left="4" Canvas.Top="2" Foreground="Black" FontSize="10"></TextBlock>
</Canvas>
After we have the required elements we will have to arrange them on the drawing area. To draw the X-axis we have to set the X1, X2, Y1 and Y2 properties:
axisX.X1 = this.AxisXLeftMargin;
axisX.Y1 = chartCanvas.Height - this.AxisYBottomMargin;
axisX.X2 = chartCanvas.Width - this.AxisXRightMargin;
axisX.Y2 = chartCanvas.Height - this.AxisYBottomMargin;
The X1 property is set to 10 by default but you can change it if you want. This is the margin (in pixels) from the left border of the drawing area (chartCanvas). The X2 property is calculated by subtracting the user defined right margin from the width of the drawing area. After we set X1 and X2, we have defined the width of the X-axis. In the same way we will define the height of the X-axis and its position.
We do the same calculations for the Y-axis. As a result we have the X-axis and the Y-axis drawn. Next the chartLineCanvas is positioned relatively to its parent canvas.
chartLineCanvas.SetValue( Canvas.LeftProperty, this.AxisXLeftMargin );
chartLineCanvas.SetValue( Canvas.TopProperty, chartCanvas.Height - this.AxisYBottomMargin );
Loading the data
We have the layout set up. Logically the next step is to load the data. As we wrote at the beginning of the article this chart supports two types of data – Excel XML Spreadsheet 2003 and a serialized list of Point objects. The way the data is imported is defined respectively in two methods returning List<Point>:
protected List<Point> LoadChartDataFromPointArrayXml( Uri chartDataLocation )
protected List<Point> LoadChartDataFromExcelXmlSpreadSheet( Uri chartDataLocation )
Let’s start with the easier one – LoadChartDataFromPointArrayXml. In Silverlight 1.1 XmlReader cannot be created from a local file because the method is not yet implemented. Therefore we will use a Stream object to create it and get the data from the XML file.
HttpWebRequest request = null;
try
{
request = new BrowserHttpWebRequest( chartDataLocation );
}
catch ( Exception ex )
{
thrownewException( "Cannot access the file specified.", ex );
}
HttpWebResponse response = request.GetResponse();
Stream content = response.GetResponseStream();
using ( XmlReader reader = XmlReader.Create( newStreamReader( content ) ) )
{ … }
First we create an HttpWebRequest object to get the XML file. As you can see the exception management is not the best here but we will continue using it just for simplicity. Then to get the data from the file we need an HttpWebResponse object. Calling GetResponseStream() method on this object we create the stream we need to create the XmlReader. The XML is pretty simple and everyone who has ever deal with XML processing perfectly aware of how to extract the data.
<?xmlversion="1.0"encoding="utf-8"?>
<ArrayOfPointxmlns:xsi="http://www.w3.org/2001/XMLSchema-instance"xmlns:xsd="http://www.w3.org/2001/XMLSchema">
<Point>
<X>0.0</X>
<Y>0.0</Y>
</Point>
<Point>
<X>1.0</X>
<Y>15.0</Y>
</Point>
…
You see? Simple as that – we have the data and are ready to start drawing the chart. But before that let’s see also how the LoadChartDataFromExcelXmlSpreadSheet( Uri chartDataLocation ) works.
The same approach we use for reading the xml generated from Excel. The only difference is how it is processed because the structure is a little bit different.
It uses the same structure – makes an HttpWebRequest, gets the underlying stream from an HttpWebRespone, creates an XmlReader and processes it. We will examine the XML processing as it is a little bit different.
Before we continue, let’s see what the XML structure of the Excel Spreadsheet 2003 is. At the beginning it contains a bunch of document properties and styles. Then for each sheet it contains a Worksheet element which we actually care about. The worksheet contains a Table element with Column, Row and Cell elements. Currently our chart works only with a single chart line. By default when you insert a chart in a Microsoft Word 2007 document you end up with three lines.
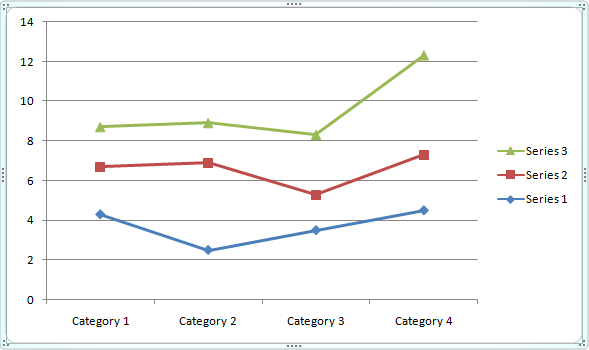
Again by default the Word 2007 separate your display on two sides – the left one shows the chart and the right one shows the data in Excel.
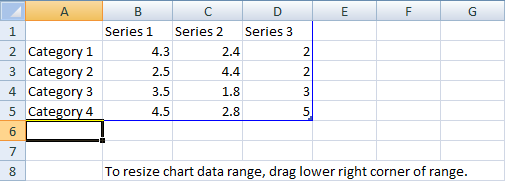
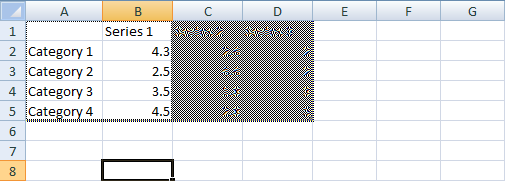
As we have already mentioned in this version our chart is able to work only with one line chart. To display only the first line (called Series 1) in this chart just drag the blue corner like shown in the image below. Also be sure to delete the “To resize chart data range, drag lower right corner of range.” because otherwise the exported XML won’t be valid and cannot be imported.
You finally end up with this chart.
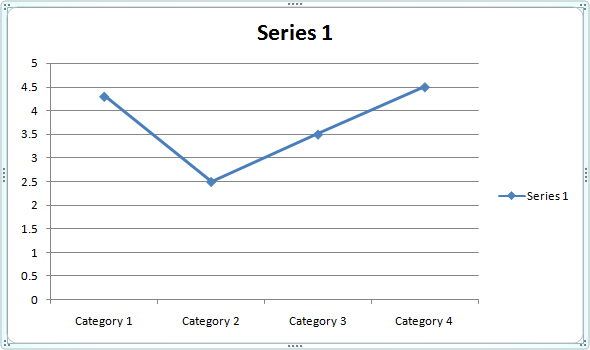
To save this chart data as an XML Spreadsheet click on the Excel Office Button, choose Save As -> Other Formats. From the dialog choose XML Spreadsheet 2003 (*.xml) as a Save as type.
Ok. Now when we finally have our data exported we can start processing it. We have a strongly defined XML structure so it is easy to navigate through the cells. The important thing to notice here is that the data contains only coordinates for the Y-axis. That’s why we set the X coordinate manually at line 25. The first point has value 0 for the X coordinate and every next point is drawn in a configurable distance through the XStep property:
protected List<Point> LoadChartDataFromExcelXmlSpreadSheet( Uri chartDataLocation )
{
…
points.Add( new Point( i, reader.ReadElementContentAsDouble() ) );
// increment X coordinate
i += this.XStep;
…
So if the XStep has value 10 then the first point of the X coordinate will have value 0px, the second - 10px, the third - 20px, and so on. That’s not the best way to do it and many professionals experienced in chart development can offer better ideas and more complex solutions. For simplicity we will go on with this solution.
Scaling the chart
We have the chart elements arranged and the chart data loaded. But to make the chart look pretty we have to scale it a little bit to fill the chart area. We will do this with a little maths. Filling the chart area can be done in several ways – scale to X-axis, scale to Y-axis or stretch the chart. The third option will give us an inappropriate result. So we have to choose between the first two options. This choice depends on the specific chart we have to scale. Basically we would scale to the Y-axis if the ratio between the chart area width and the max Y coordinate is less than the ration between the chart area width and the max X coordinate and vice versa. This is true because otherwise we risk clipping the chart.
// subtract the margins between the axisX(axisY) and the canvas and divide by the chart line max X(Y) coordinate
double scaleFactorX = ( axisX.X2 - axisX.X1 ) / this.GetChartLineMaxX( chartData );
double scaleFactorY = ( axisY.Y2 - axisY.Y1 ) / this.GetChartLineMaxY( chartData );
// scale by x or y to fit the chart area
scaleFactor = scaleFactorX < scaleFactorY ? scaleFactorX : scaleFactorY;
for ( int i = 0; i < chartData.Count; i++ )
{
chartData[ i ] = new Point( chartData[ i ].X * scaleFactor,
chartData[ i ].Y * scaleFactor );
}
After we have these calculations we define the result value as a scaleFactor. Instead of using a transformation we just multiply that chart points by this scale factor. This way we ensure that the chart will be drawn properly and only the points will be scaled.
And that’s it. We have the data scaled properly. Now just assign the data to the chartLine. Points and the Polyline (chartLine) handle the drawing.
chartLine.Points = chartData.ToArray();
Drawing the chart data points
We are ready with the line drawing. Now on the top of each point of the chart we will draw a circle which will show the X and Y values on mouse over. We do this by iterating through the chartLine points and creating a new Ellipse object. We set some basic properties like Cursor, Fill, Width, Height and Opacity. Aside from these properties we need to set the position of each ellipse and handle the MouseEnter, MouseLeave and MouseMove events. Each point is added as children in the canvas that also contains the chartLine. Therefore we set the ellipse position to be relative to the chartLineCanvas using the current X and Y coordinates of the point.
Ellipse chartDataPoint = newEllipse();
chartDataPoint.Cursor = System.Windows.Input.Cursors.Hand;
SolidColorBrush brush = newSolidColorBrush( this5ChartDataPointFill.Color );
chartDataPoint.Fill = brush;
chartDataPoint.Width = this.ChartDataPointSize.Width;
chartDataPoint.Height = this.ChartDataPointSize.Height;
chartDataPoint.Opacity = this.ChartDataPointOpacity;
chartDataPoint.SetValue( Canvas.LeftProperty, x - ( chartDataPoint.Width / 2 ) );
chartDataPoint.SetValue( Canvas.TopProperty, y - ( chartDataPoint.Height / 2 ) );
chartDataPoint.SetValue( Canvas.ZIndexProperty, 2 );
Dealing with the tooltips
To show and hide the tooltips we need to handle the ellipse’s MouseEnter and MouseLeave events. On MouseEnter we initialize the tooltip text and size and on the last line – we show it:
protected void ShowToolTip( object sender, MouseEventArgs e )
{
…
double chartDataPointCenterX = ( double )chartDataPoint.GetValue( Canvas.LeftProperty ) +
chartDataPoint.Width / 2;
double chartDataPointCenterY = ( double )chartDataPoint.GetValue( Canvas.TopProperty ) +
chartDataPoint.Height / 2;
tooltipText.Text = string.Format( this.ToolTipFormatString, ( chartDataPointCenterX /
scaleFactor ).ToString( "0.##" ), ( chartDataPointCenterY / scaleFactor).
ToString( "0.##" ) );
tooltipRectangle.Width = tooltipText.ActualWidth + 2 *
( double )tooltipText.GetValue( Canvas.LeftProperty );
tooltipRectangle.Height = tooltipText.ActualHeight + 2 *
( double )tooltipText.GetValue( Canvas.TopProperty );
tooltipCanvas.Visibility = Visibility.Visible;
}
To get the exact coordinates we calculate the center coordinates of the sender point. But we should not forget that the point is transformed and so as to calculate the actual coordinates we have to divide the center coordinates by the scaleFactor.
Then the mouse cursor is not on the ellipse when the tool tip has to be closed:
protected void HideToolTip( object sender, EventArgs e )
{
tooltipCanvas.Visibility = Visibility.Collapsed;
}
We also should handle the MouseMove event to move the tooltip as the mouse moves:
protected void MoveToolTipCanvas( object sender, System.Windows.Input.MouseEventArgs e )
{
…
Point mousePosition = e.GetPosition( this );
tooltipCanvas.SetValue( Canvas.LeftProperty, mousePosition.X );
tooltipCanvas.SetValue( Canvas.TopProperty, mousePosition.Y + this.ToolTipTopMargin );
}
That is the ShowToolTip method. The HideToolTip method just set the tooltipCanvas visibility to Collapsed. The MoveToolTip method gets the mouse position and set the LeftProperty and TopProperty respectively to the mouse position X and Y coordinates.
Notice that the TopProperty is the sum of the mousePosition Y coordinate and a user defined margin. This will draw the tooltip this.ToolTipTopMargin pixels below the mouse.
Conclusion
In this tutorial we show how to build easily a simple line chart, how to use common UI elements and transformations from the framework, how to load and process an XML file in Silverlight. As you can see even with this small framework a lot of things can be done without much effort. Of course with the final version of Silverlight 1.1 it will be easier at least to process the XML file – there XLINQ will be available.
We hope we help you learn something useful. We will continue with more articles that will add new features to the chart and also with more chart types.